
Here is how I run a quarterly business review. A quarterly business review (QBR) is a 45- to 60-minute meeting where you and the customer's decision makers look at the value delivered last quarter, agree on the goals for the next one and settle who does what. The number at the center of a good QBR is value delivered: quarterly value = hours saved × loaded hourly cost + revenue gained or protected. If your product saved a partner team 900 hours at $40 an hour, that is $36,000 in one quarter, and that line will carry the meeting.
This is Part 3 of The Account Management Playbook. Part 1 covered the account plan and Part 2 the stakeholder map; the QBR is where both meet the customer. Below is the agenda I use, how I prepare, how I calculate value and the follow-up that makes the next QBR easier.
Why most QBRs fail
Most QBRs are product demos with a usage chart at the start. The customer's executive attends once, sees forty slides about feature adoption and sends a deputy next time. By the third quarter the meeting is cancelled, and nobody notices until renewal.
The fix is to change whose meeting it is. A QBR is the customer's meeting about their goals, where your product appears as evidence. When I started running them that way, attendance from senior people went up and the meetings got shorter.
Three other mistakes show up again and again:
- Inviting the wrong people. A QBR with only day-to-day users is an operational review. Useful, but it will not move a renewal.
- Hiding bad news. If the customer raises the outage before you do, the rest of the meeting is spent defending.
- Ending without owners. A QBR that closes with "great discussion, let's follow up" produces nothing you can measure next quarter.
How to run a quarterly business review: the 60-minute agenda
I use the same structure every time so customers know what to expect:
- Goals recap (5 minutes). The two or three outcomes from the account plan, in the customer's words.
- Value delivered (15 minutes). What changed for them last quarter, in hours, money or risk, with one customer quote.
- What did not go well (10 minutes). Open issues, support trends, missed milestones. Say it before they do.
- Next quarter's goals (20 minutes). The longest block. Agree on the outcomes and the milestones that prove them.
- Asks and owners (10 minutes). What you need from them, what they need from you, with dates.
Notice where the time goes. Half the meeting looks forward. The backward-looking part exists only to earn the right to plan the next quarter together.
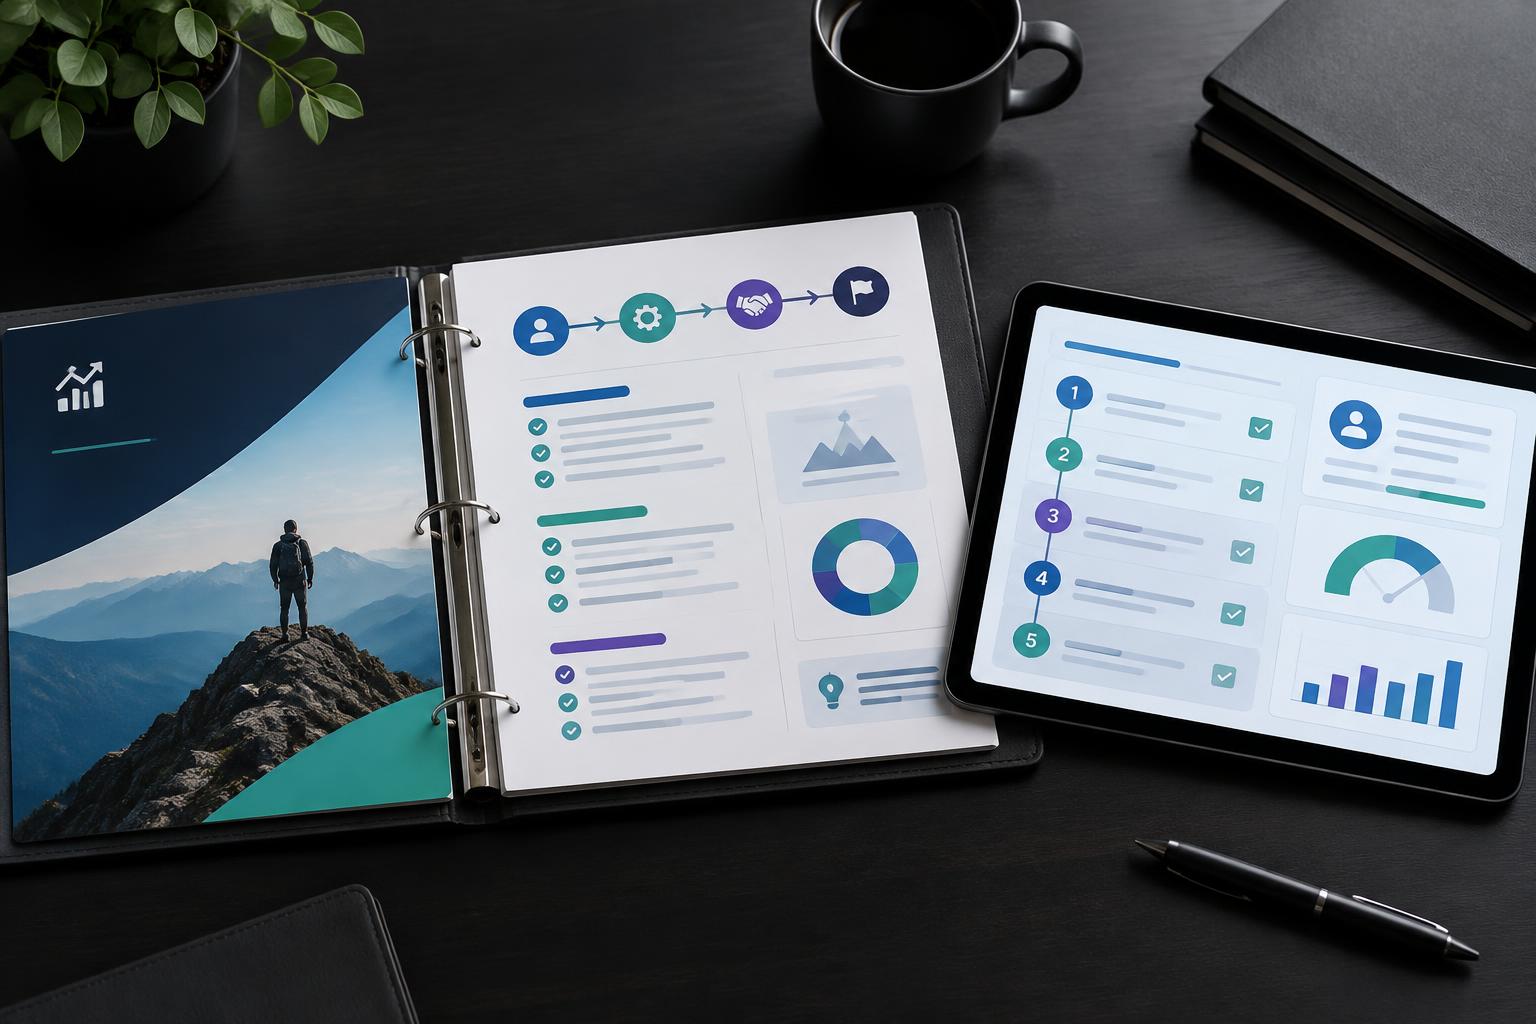
Free download
Get the customer health score model
Five components, weights, risk bands and a quarterly validation routine, ready to use with your team.
The download button appears here right away; nothing is sent to your inbox. Your email also joins Clarivoxx Insights (a weekly article and a monthly newsletter). Unsubscribe in one click. Privacy
How do you prepare a QBR in one week?
Preparation is where the quality comes from. My checklist, about five working days ahead:
- Pull the data: usage, support tickets, health score, open actions from the last QBR.
- Calculate value using the formula above. If you cannot get hours saved, use a proxy the customer already tracks, like bookings processed or errors avoided.
- Call the champion for 15 minutes. Share the draft story and ask what their boss cares about this quarter. That call changes the deck almost every time.
- Confirm the right attendees. Use your stakeholder map. If the economic buyer is not coming, ask the champion what would make it worth their time.
- Cut the deck to eight slides or fewer. The QBR template has the layout I start from.
The number that carries the QBR
Quarterly value = hours saved × loaded hourly cost + revenue gained or protected. Here 900 × $40 = $36,000. Annualized, $144,000 ÷ $120,000 ARR = 1.2× the contract value.
Here is the value line for an illustrative account paying $120,000 a year. One number like this is worth more than ten usage charts.
If the customer's executive learns nothing new in the first ten minutes, you have lost them for the rest of the meeting.
How should you present value in a QBR?
Lead with the outcome, then the evidence. "Your team spent 900 fewer hours on manual rate fixes this quarter" lands better than "automation usage grew 34%". I show one chart with progress against plan for each of the customer's goals, so the picture is visible at a glance.
Progress on the customer's three goals
Show the lagging goal on the same slide as the wins, with a recovery action.
Be honest about the gaps. In this example, the partner-onboarding goal is behind plan. I put it on the slide in the same color as the wins. Customers trust the good numbers more when they see you show the bad ones.
What I have seen in practice
With hotel and travel partners, my early QBRs were usage reports translated into French or English, and they were dull in both languages. The turning point came with a partner in the Gulf whose regional director agreed to join only if the meeting stayed under 45 minutes. I cut the deck to six slides: their goal, what changed, what did not, next quarter's goals, asks and a one-line summary. The director stayed for an hour and asked for a second session with his finance team.
The other lesson was about follow-up. In one account, we agreed on four actions in the QBR and nobody wrote them down. Three months later, both sides remembered different promises. Since then I send a written summary within 24 hours, and the open actions become the first slide of the next QBR.

The QBR dashboard I review every month
I track QBRs across my strategic accounts in one small table. Here it is with illustrative numbers for 12 strategic accounts.
| Metric | Target | This month | Last month | Change |
|---|---|---|---|---|
| QBRs held on schedule | 100% | 83% | 75% | +8 pts |
| QBRs with economic buyer present | 75% | 58% | 50% | +8 pts |
| Summary sent within 24 hours | 100% | 92% | 80% | +12 pts |
| QBR actions closed by next QBR | 80% | 69% | 62% | +7 pts |
| Accounts with quantified value | 100% | 75% | 67% | +8 pts |
The economic-buyer row predicts renewals better than any usage number I track. When it drops, I go back to the stakeholder map and ask the champion why. For the retention side of the conversation, the NRR calculator helps you show the account's trend in the same terms finance uses.
Actions agreed in the QBR
Frequently asked questions
What should be included in a QBR?
A recap of the customer's goals, the value delivered, what did not go well, next quarter's goals and a list of actions with owners. Product roadmap content is optional and should be short.
How long should a quarterly business review be?
Between 45 and 60 minutes. If you need longer, split the operational review into a separate working session.
Who should attend a QBR?
From the customer side: the champion, the economic buyer or executive sponsor and one or two key users. From your side: the account manager or CSM, plus a senior leader for strategic accounts.
Do small accounts need QBRs?
Usually not in full. Smaller accounts can get a short written business review or a twice-yearly call instead.
Key takeaways
- A QBR is the customer's meeting about their goals; your product is the evidence.
- Quarterly value = hours saved × loaded hourly cost + revenue gained or protected.
- Spend half the meeting on next quarter's goals and actions.
- Call the champion before the QBR and send a written summary within 24 hours after it.
Coming next in this series
Next Monday: Part 4, how to build a customer success plan with the customer, with goals, milestones and a shared scorecard both sides can track.

Go further with the ebook
The Professional Customer Support Playbook
Better replies, fewer escalations, a clear path from agent to leader.
$19.99 · 103 pages · View the book